- Teaching Graphs
- 📍 Common Uses of Graphs
- 🧠 Warm-Up Activity
- 🗺️ Graph Representations
- 🧠 Warm-Up Activity: Amazon Delivery Driver
- 🍿 Popcorn Hack: Graph Representation of Cities
- 🏠 Homework Hack: College Board Example
Teaching Graphs
📌 Definition
Graphs are a fundamental data structure in computer science used to model relationships between objects.
Each object is a node (vertex), and the connection between them is an edge (arc).
- In a complete graph, there is a single edge between every pair of distinct vertices.
- There are no loops and no multiple edges in such graphs.
📍 Common Uses of Graphs
- Pathfinding algorithms (e.g., Google Maps, GPS)
- Web page ranking (e.g., Google’s PageRank algorithm)
- Network routing (e.g., data packet transfers)
🧠 Warm-Up Activity
Scenario:
You’re an Amazon delivery driver. You have 10 packages to deliver to 10 houses in a neighborhood.
Questions to consider:
- What strategies would you use to decide where to go first?
- How do real-life delivery companies solve this problem?
- Would it be practical to try every possible route? Why or why not?
This activity introduces students to graph-based optimization problems, like the Traveling Salesman Problem.
🗺️ Graph Representations
✅ Adjacency Matrix
- A matrix of size
n x n(wherenis the number of vertices). - Stores 0s and 1s:
1if there’s an edge between two vertices;0otherwise.
Undirected Graph Example
Each edge is bidirectional, so if there’s a connection between vertex i and j, both matrix[i][j] and matrix[j][i] will be 1.
Directed Graph Example
Connections are one-way: if there’s an edge from i to j, only matrix[i][j] = 1.
✅ Adjacency List
- Uses an array of lists to represent which vertices are connected.
- Each index in the array corresponds to a vertex.
- Each element in the list is a neighboring vertex.
✅ Completed Hacks
🧠 Warm-Up Activity: Amazon Delivery Driver
Prompt:
Imagine you are a delivery driver for Amazon. You have 10 packages to deliver to 10 different houses in a neighborhood. What’s the best way to plan your route so you don’t waste time and gas?
Response:
To plan the most efficient route, I would:
- Identify clusters of houses to minimize backtracking.
- Use a graph to represent houses (nodes) and roads (edges), with edge weights as travel time or distance.
- Apply a pathfinding algorithm like Dijkstra’s or A* to find the shortest path.
- Consider using a heuristic like Nearest Neighbor as a greedy approximation for the Traveling Salesman Problem (TSP).
Why not try every possible route?
There are 10! = 3,628,800 possible permutations, which is computationally inefficient. Real-world systems use smart heuristics or optimization algorithms to find near-optimal paths quickly.
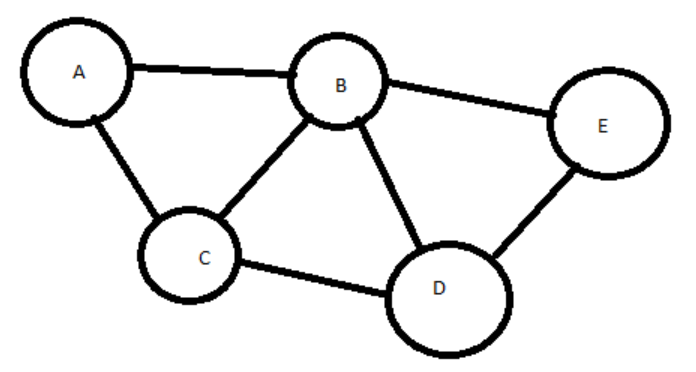
🍿 Popcorn Hack: Graph Representation of Cities
Prompt:
How can we represent cities and paths as graphs?
Response:
- Nodes (Vertices): Cities
- Edges: Roads between the cities
- Weights on Edges: Could represent distances, tolls, or travel time.
Example:
We draw a graph with 5 cities: A, B, C, D, E
- A ↔ B (10 mi)
- A ↔ C (20 mi)
- B ↔ D (15 mi)
- C ↔ D (30 mi)
- D ↔ E (10 mi)
Using this graph, we can:
- Evaluate different paths from A to E.
- Use shortest path algorithms to find the optimal route.
- Add or remove roads dynamically to simulate construction or closures.
🏠 Homework Hack: College Board Example
Q1: In which of the configurations is it possible to have redundant routing between devices Q and V?
Answer:
C) Both configuration I and configuration II
Explanation: Redundant routing exists when multiple paths connect Q and V, which appears in both configurations.
Q2: In configuration I, what is the minimum number of connections that must be broken or removed before device T can no longer communicate with device U?
Answer:
B) Two
Explanation: There are at least two distinct paths between T and U. Removing both will isolate communication.